A TENTATIVE ANALYSIS OF CRUDE OIL PRICE VARIATIONS OVER A 175
YEARS PERIOD
A.
After refining, crude oil is used mostly in four forms
1. Fuel for road, rail,
marine, and air transportation
2. Fuel for residential and
industrial heating
3. Raw material and fuel
for the petrochemical industry
4. Electricity generation
(used extensively for electricity generation in some regions; about 6% of
global oil production is used for that purpose overall)
B. Trade
Producers sell crude oil
physically to refiners, with which they are sometimes integrated, directly or
through traders, either for cash or through futures contracts or options. Part
of the production is stored for later release, either by producers or buyers,
or by governments, depending on market status. Production is currently about 90
million barrels per day (mmbbld) and, as an average, producers transfer to refiners a daily quantity
equal to one day of production.
C. Financial markets
In parallel with the
physical spot market where crude is sold for cash, there are important
financial markets, in the U.S., in London, in the Middle East and in Asia,
where financial instruments derived from physically traded crude oil are
exchanged, mostly as options or futures. The total volume traded daily is
between 20 and 40 days of production. There are two categories of traders in
these markets : those who produce and use crude
oil, and those who trade the derivatives with a financial purpose only. The
number of contracts traded in each category is more or less equivalent.
Some observers contend
that the trading of 20 to 40 days of production would lead to out-of-hand
speculation and market manipulation, but it seems that apart from some
short-term fluctuations, such is not the case, which numerous academic studies
seem to confirm by observation of significant price variations. In fact, all
that is produced once storage is full must be sold immediately to refiners for
eventual public consumption, at whatever price the market will bear, and the
total available intermediate storage capacity represents only a few days of
production. The only way to drive the price of the commodity up voluntarily is
to create a relative shortage by either reducing production and therefore
leaving the commodity in its production basin, or storing it somewhere between
production well and
consumer. The only party able to store all or part of crude oil
production in the long run is crude oil producers, in the production
reservoirs.
D. Physical storage
Crude oil can be stored
in various ways :
1. On land: in storage facilities,
above- or underground. World storage capacity is 45 days of production, 15 days
belonging to governments and 30 to private owners. In the U.S., where 2/3 of
the capacity belongs to the government, total capacity is 11 days of world
production. Other than governments, these facilities are controlled mostly by
producers and refiners. During the last 30 years, capacities have fluctuated by
only about 20%, which means that their flexibility is only about 10 days of
production.
2. At sea : global
capacity of marine crude oil carriers is about 20 days of production,
continuously on the move for the main part, but between 0 and 20% of that
capacity, according to market conditions, is on stand-by and can be used as
floating storage if needed, for up to 4 days of world production. This kind of
storage can be controlled by anyone with the wherewithal to do so.
3. In the underground
reservoirs whence crude oil is produced, each time production either slows down
or even stops, according to demand, as is often the case in the U.S. when
prices are low, sometime below production cost. Their known capacity is 19,100
days of production (52 years). Producers are the only party able to control
these reservoirs. They use them for storage, in an equivalent fashion, when
they sell future contracts or options, or when they try to create artificially
a general shortage in concert with other producers, a practice that has been
illegal in all democracies since the very early 20th century but is
tolerated of OPEC members.
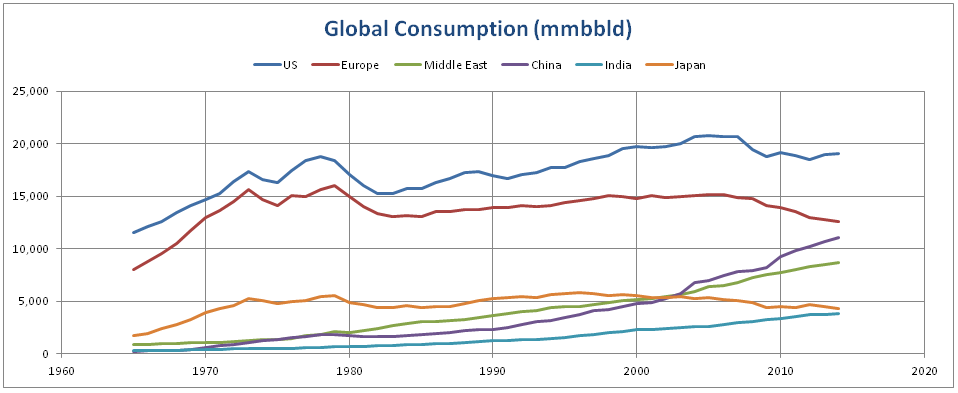
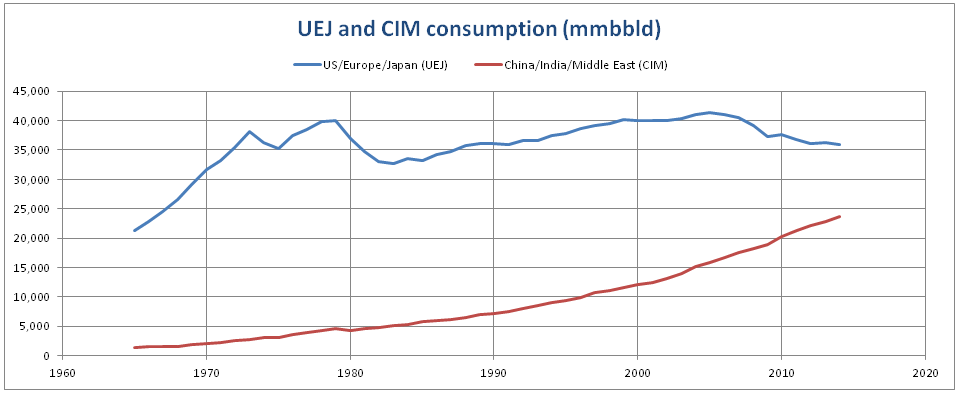
E. Crude oil consumption
since 1965
In the U.S., in Europe,
and in Japan (UEJ), consumption has been declining
for several years. In China, India, and in the Middle East (CIM),
consumption still increases, although economic indicators for China and India
hint that these countries’ growth is plateauing.
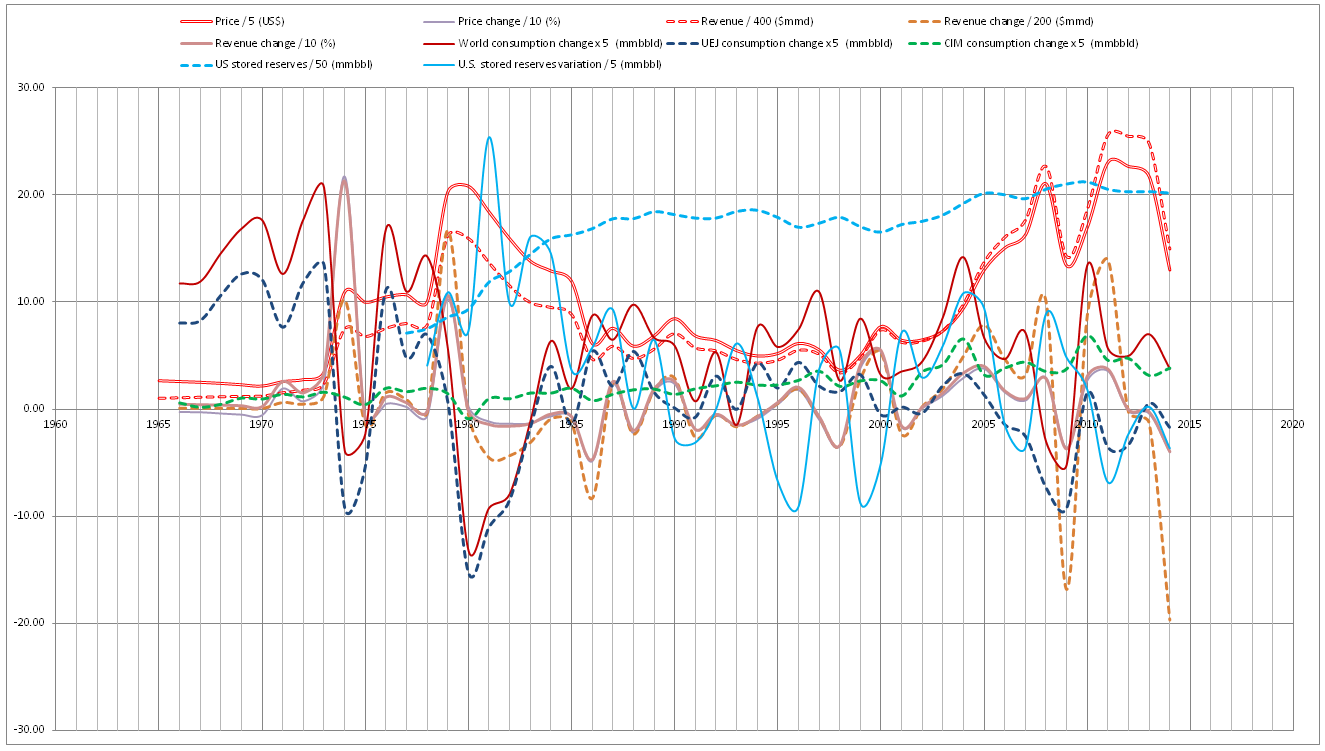
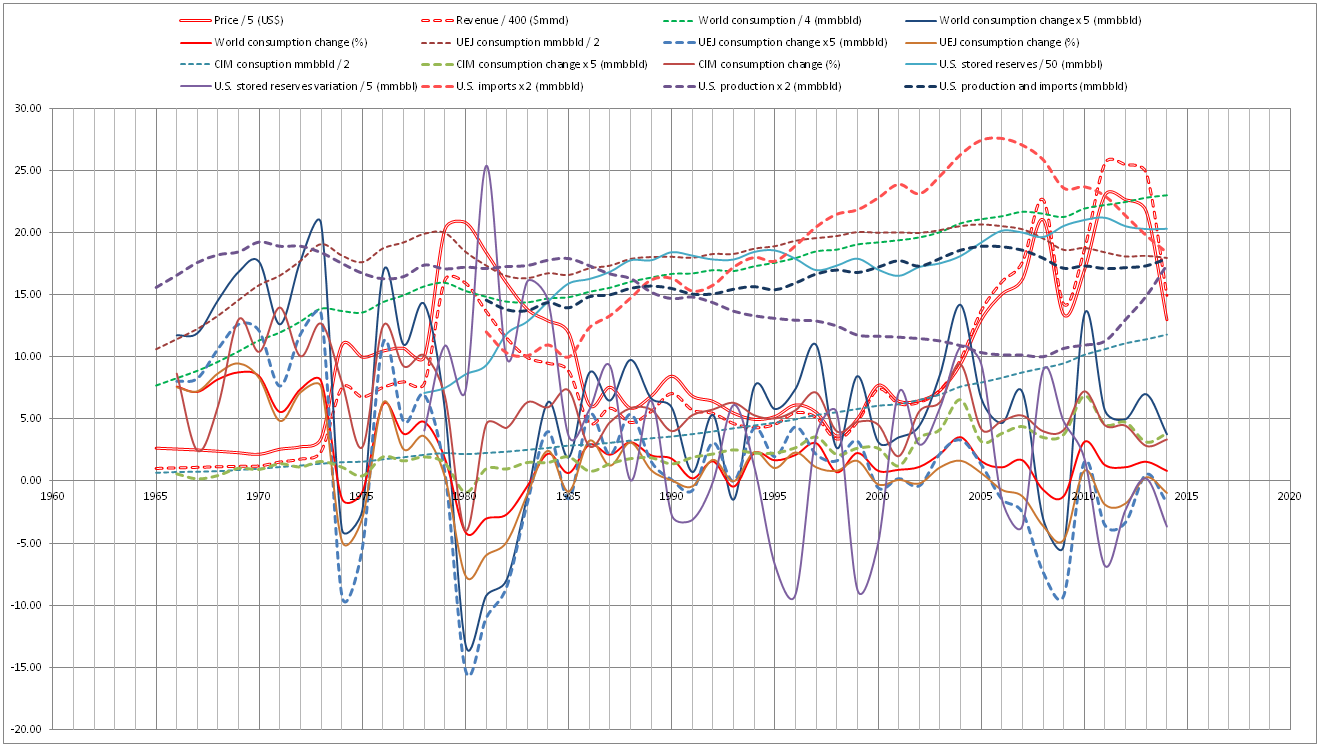
F. Comparing crude oil
prices since 1965 with changes in world consumption, changes in UEJ and CIM consumptions, and
U.S. stocks, as well as changes in U.S. stocks
Prices are year
averages, filtering out or dampening all short term variations. All prices are
in constant 2014 dollar. The only correlation, and not systematic at that, is
that UEJ consumption decreases when prices increase
steeply. CIM consumption is less affected. Changes in
U.S. stocks are either in correlation or in opposition with prices.
G.
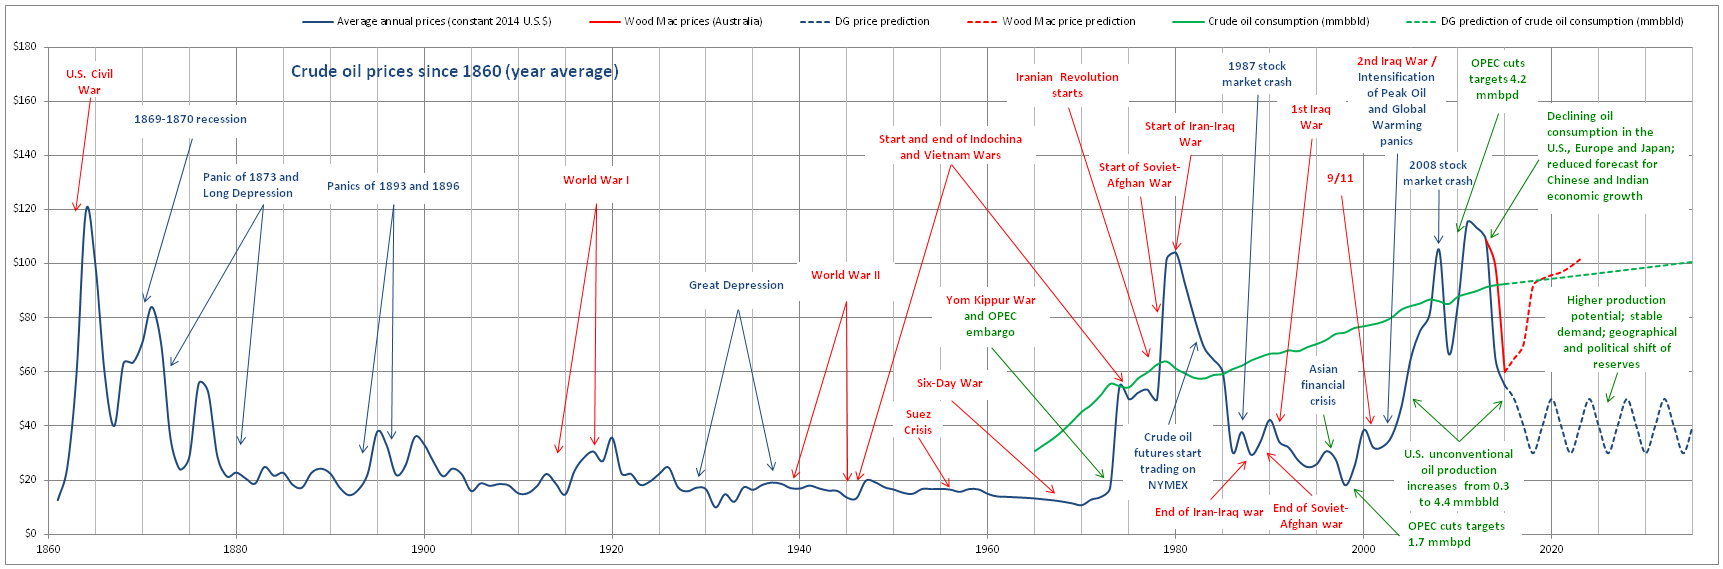
History of prices, 1860 to 2015, and probable future
Prices are year
averages, filtering out or dampening all short term variations.
H. Probable causes
Prices are year averages, filtering out or dampening all short
term variations. In particular, major unforeseen meteorological events, such as
hurricanes on the Eastern seaboard of the U.S. and in the Gulf of Mexico,
commonly result in a short term supply disruption that temporarily affects spot
prices, sometime greatly, but worldwide annual average prices only marginally.
Since the late 19th century, there have been only two
major periods of high prices: 1973 to 1986 and 2004 to 2014.
1. UP, 1973 to 1980: an embargo is imposed by Arab producers following the Yom Kippur War.
Prices increase from $17 to $55 in 1974, down to $50 in 1978 and up to $105
in 1980
2. DOWN, 1980 to 2004: in 1986 price is down to $31 and continues falling to $18
in 1998. It won’t be until 2004 that prices rise again above $50.
3. UP, 2004 to 2008: prices rise from $50 to $105
4. DOWN, 2008 to 2009: prices decrease to $67
5. UP, 2009 to 2014: prices increase up to $115
6. DOWN, 2014 to 2015: prices decrease to below $40 in August 2015
Historically, if the period from 1860
to 1880 is excluded as being pre-self propulsion age,
prices between 1880 and 2015 (135 years) were above $40 in constant 2014
dollars only for 23 years (17% of the time), in two periods of 13 and 10 years.
It seems that warfare and political
events are not necessarily synchronous with price variations, and neither is
U.S. storage capacity.
All three price increases were
triggered by deliberate efforts by Arab producers to manipulate markets through
production cuts.
After each of the first two
occurrences, market reacted by a drop of consumption. The first drop, from 1979
to 1983, was of 6 million barrels per day. A drop of 7.3 million barrels per
day occurred in the U.S., Europe, Japan region (UEJ)
but was dampened by the rise of Chinese, Indian, and Middle Eastern (CIM) consumption. From 2005 to 2015, the drop of UEJ consumption was 5.4 million barrels per day, again
dampened, and soon compensated, by an increase of CIM
consumption.
Additionally, the major event during
the second high price period was the development of U.S. unconventional
production and the synchronous decrease of U.S. imports. Between 2006 and 2015
U.S. production increased by 3.7 million barrels per day and imports decreased
by 4.6.
All price decreases were triggered by
a decrease of either global or UEJ consumption. The
2009 price increase saw the conjunction of the threat of a large production cut
and a temporary pause in the UEJ consumption
decrease.
Although price variations appear to be
sometime irrational in their amplitude, occasionally responding hyperbolically
to perhaps unreasonable fears, it seems that price variations respond
exclusively to supply and demand forces, influenced by political events only as
far as these induce OPEC producers to cut production drastically from time to
time. Each major price increase followed deliberate production cuts calculated
explicitly to manipulate the market. Each major price decrease followed
significant decreases in UEJ consumption, which
exceeded production cuts and were made possible mostly by efficiency
improvements. Furthermore, increasing U.S. production resulted in decreasing
imports. Some of the dips in consumption were no doubt due to production cuts,
but the 2009 threat of a 4.2 million barrels per day production cut was
followed by an actual worldwide 7 million barrels per day increase in
consumption, showing that either the threat had not been carried out, or
production cuts had found a substitute outside of OPEC.
This last circumstance was not lost on
Saudi Aramco when it decided not to proceed with production cuts as prices
started to tumble in July 2014.
Since the two steep price increases of
1973 and 2004 many things have changed in the oil market, which will no doubt
reflect on how prices vary in the future:
1. OPEC, and particularly Arab producers, do not control anymore a share of
production large enough to give them unilateral control of the supply side of
market
2. The U.S. is again the largest producer of crude oil, thanks partly to the
development of unconventional fields. The U.S. is also the largest producer of
natural gas and the second largest coal producer (behind China). Restrictions
on oil and gas exports have been eased by Congress.
3. The world’s largest reserve has shifted from Saudi Arabia to South
America
4. Consumption in the rich economies, particularly in the UEJ region, has not increased since 1973, mostly as a
consequence of technical innovation, and currently continues to decrease
5. Chinese and Indian consumption give signs of levelling out, a double
digit economic growth having become unsustainable in both countries
6. The “peak oil” scare seems to have been somewhat subdued after it was
recognized that despite increased global production, known reserves have
continuously increased in the last 35 years: in retrospect, and based on
current knowledge, it can be calculated that 1980 oil reserves were greatly
underestimated, at ¼ of what their assessment would be today.
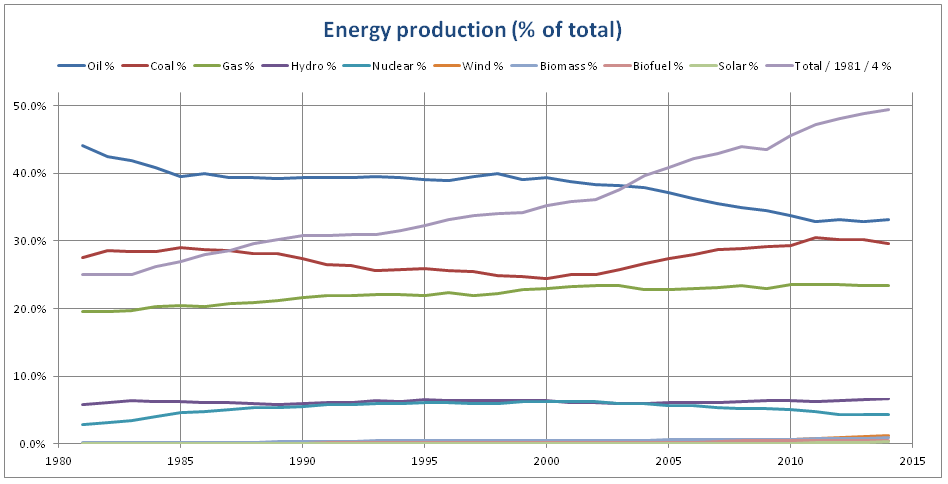
I.
Coal and natural gas
Coal and
natural gas are the major energy sources for electricity generation but compete
with petroleum products as raw material for the chemical industry and as fuel
for heating purposes, either directly for natural gas or through co-generation
for coal in the developed world and directly elsewhere. Since 1981 global
energy consumption has increased by nearly 100% but the share of oil decreased
from 44% to 33% while coal’s share increased from 28% to 30% and natural gas
from 19% to 23%. Renewables increased from 0.1% to 2.5%. Since around 2000 oil
lost a 7% share while coal gained 6% and gas was flat at 23%.
Coal
is little used for automotive propulsion, the production of synthetic gasoline
being less than a quarter million barrels per day, and as regards natural gas
only between a half and a million barrel-equivalents per day is produced for
compressed natural gas vehicles, but all areas where oil competes with coal and
natural gas have a direct effect on global oil demand, and therefore price. It
so happens that since 2000 the relative productions of coal and oil have varied
in almost exactly opposite fashion, which can explain in part the unexpected
assistance volunteered by the oil and gas industry in support of the carbon
dioxide greenhouse effect theory, a theory that puts much more blame and odium
on coal than on oil and gas.

J.
The probable future
Based on
historical data and patterns, as well as relatively recent fundamental changes
in the crude oil market structure, it seems average annual oil prices in the
next few decades are likely to remain at the $40 average level, oscillating
between $30 and $50 a barrel, a level that is higher than during the past
periods of low prices because of higher production costs for unconventional
petroleum than for conventional. Any technological improvement leading to a
cost decrease of unconventional production will put downward pressure on global
oil prices.
It could be that
the only way to push oil (and natural gas) prices up in the long term would be
for concerted government action to put severe restrictions internationally on
global coal consumption. Although western governments endeavor to put such
restrictions into effect, it seems unlikely that Asian governments, Korea and
Japan apart, will follow suit just to please oil interests to the detriment of
the consumer and the economy, except of course if intense environmental
lobbying gained traction on these governments, an unlikely scenario for the
time being in those relatively poor countries (on a per capita basis), where
environmental worries, real or imaginary, will remain a luxury until everyone's
basic needs are satiated.
MMM
December 2014 – August 2015
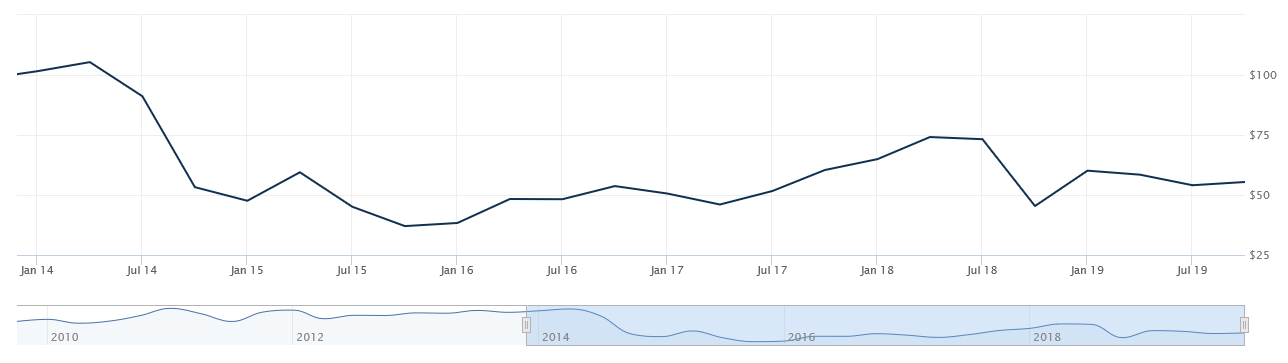
December 2019
In the five years since this study was first written, it appears that prices oscillated between $37 and $74, remaining most
of the time between $40 and $60, rather than the predicted $30 to $50, a 25% divergence.